 RSS2 Feed RSS2 Feed |
 |
| Debbuging not showing the same html than in standard browser |
|
Hello to you.
I've just installed the new 8.1 version of PhpED and working on a Web application. Everything works fine except that I've notice that when i'm doing a debbug session, in Chrome (I do all my debbuging in Chrome instead of internal IE), I don't have the same result as when I look at my app. directly in Chrome. In Chrome via PhpED debbuging session 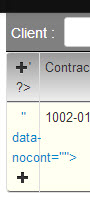
(wrong way) Directly in Chrome 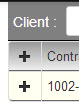
(what its supposed to be) Here are the lines of code:
I've verified that short tags is set to true, in project settings and even in php.ini of PhpED. Does anybody have a clue on that...? |
||||||||||||||
|
|
|||||||||||||||
|
Site Admin
|
This can not happen on debugger's own intents. It does not change any single php setting.
Check if you have conditional Breakpoints and/or statements in Watch that may result in getting some text to the output. Also check if you have any php accelerators/caches. |
||||||||||||
|
_________________ The PHP IDE team |
|||||||||||||
| Debbuging not showing the same html than in standard browser |
|
||
|
|
Content © NuSphere Corp., PHP IDE team
Powered by phpBB © phpBB Group, Design by phpBBStyles.com | Styles Database.
Powered by
Powered by phpBB © phpBB Group, Design by phpBBStyles.com | Styles Database.
Powered by